
The Asia-Pacific region accounts for more than 50% of global air cargo growth
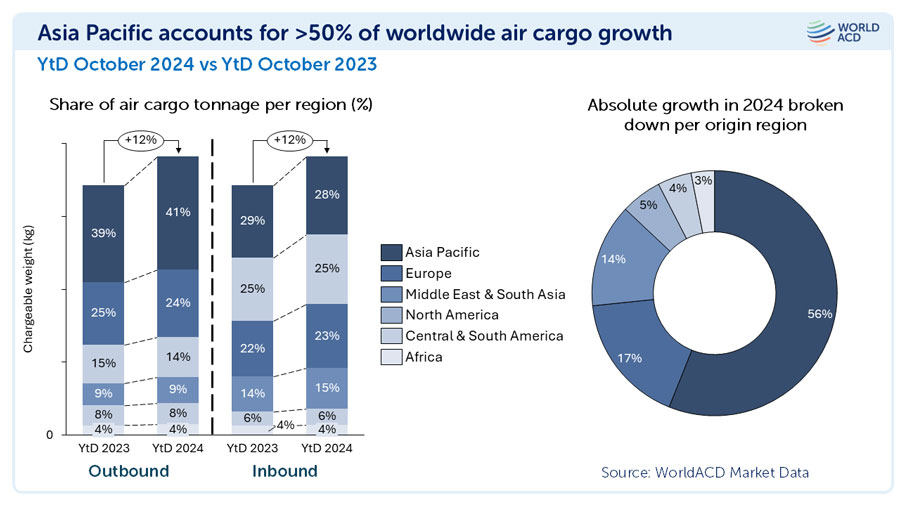
According to WorldACD market data analysis, the region's manufacturing dominance continues to drive global tonnage growth, contributing 56% of the +12% year-on-year global tonnage growth in the first 10 months of 2024.
According to WorldACD market data analysis, Asia Pacific origin markets will continue to contribute a significant share of global air cargo growth this year, accounting for more than half (56%) of the +12% year-on-year increase in global cargo volumes in the first 10 months of 2024.
Asia Pacific's strong contribution this year meant its share of global outbound freight volume rose two percentage points from 39% last year to 41%, well ahead of Europe's 24%, Central and South America's 14%, the Middle East and South Asia (MESA) 's 9%, and North America's 8% market share. Based on more than 2 million transactions per month covered by the WorldACD database, Africa's share of outbound and inbound air cargo volumes remained steady at 4%.
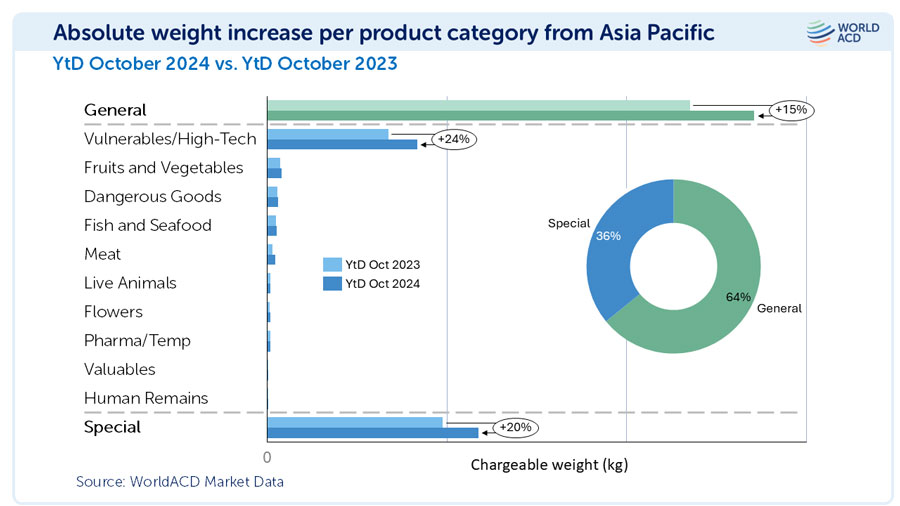
Fragile/high-tech goods led the specialty goods growth
As of the end of October, Asia Pacific accounted for 56 percent of the year-to-date global growth, with general freight contributing almost two-thirds (64 percent), thanks to the large amount of e-commerce traffic classified as general freight, while special freight contributed 36 percent. The special freight element is dominated by the consumable parts/high-tech products category, which accounts for about 80% of the growth in special freight.
For Hong Kong, all of the growth in October came from specialty cargoes, mainly wearing parts/high-tech cargoes, while general cargoes recorded a slight year-on-year decline in billed weight. Growth in Miami was a balance of general and specialty goods, while growth in Dubai, Shanghai and Tokyo came mainly from general goods.
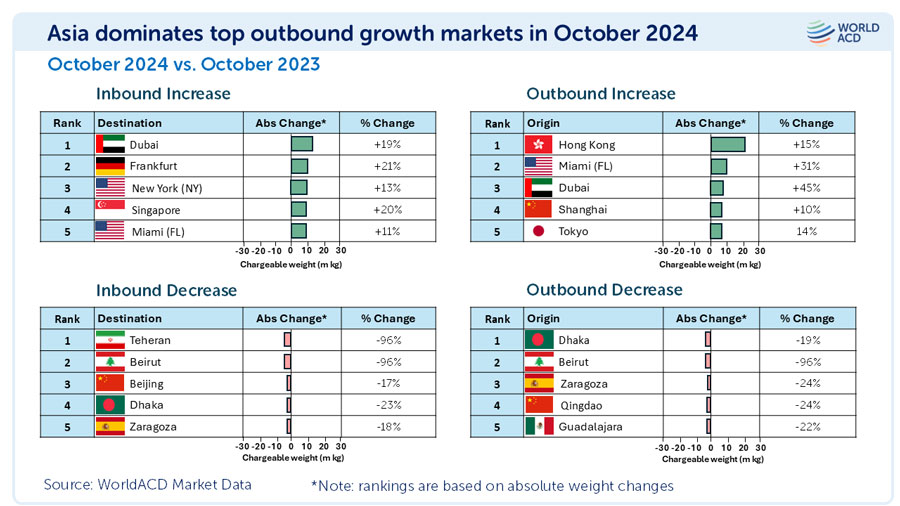
Dubai topped the top five markets for year-on-year arrivals growth in October with a 19 per cent increase, followed by Frankfurt, New York, Singapore and Miami. Growth in all five cities was driven by general goods, with specialty goods accounting for about one-quarter to one-third of the increase, and with the exception of New York, all cities were led by fragile/high-tech goods, while temperature-controlled goods (mainly pharmaceuticals) were the largest category of specialty goods import growth.
At the same time, the top five cities with year-on-year declines in inbound passenger throughput were Tehran, Beirut, Beijing, Dhaka and Zaragoza, with Tehran and Beirut experiencing almost zero inbound passenger throughput: Inbound passenger throughput at both airports in October was down -96 percent year-on-year, as most commercial flights to and from Iran and Lebanon were suspended last month.
Dhaka, Beirut and Zaragoza (affected by political unrest, conflict and flooding, respectively) were also among the five markets with the biggest declines in outbound travel in October, followed by Qingdao in China and Guadalajara in Mexico.
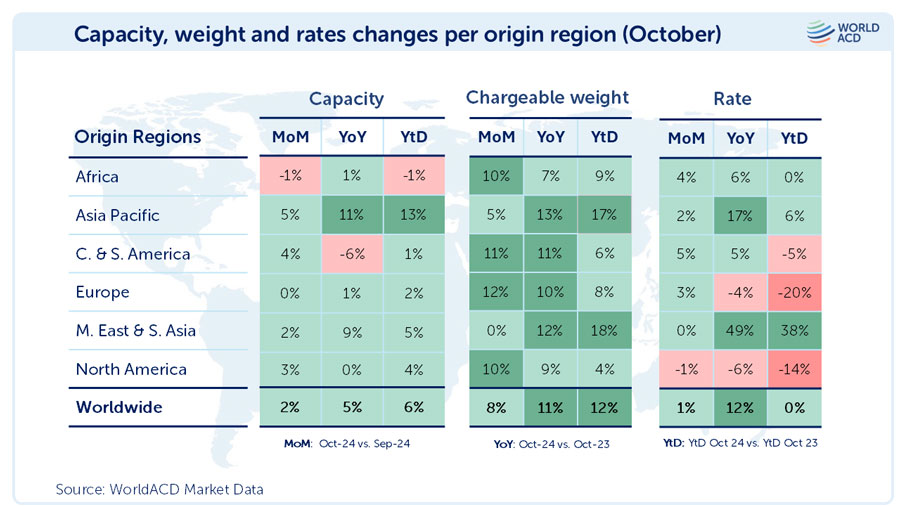
Freight, capacity and tonnage all rose in October
According to WorldACD's analysis, global air billable weight increased by 8% month-on-month in October and by 11% compared to October last year. In October, all six of the world's major originating regions recorded month-on-month and year-over-year growth, with Europe (+12%), Central and South America (CSA, +11%), North America (+10%) and Africa (+10%) all Posting double-digit month-on-month tonnage percentage increases. All six regions contributed to year-over-year growth in the 10 months to the end of October, with total billable weight up 12%, with the Middle East and South Asia (MESA, +18%) and Asia Pacific (+17%) Posting the largest year-to-date increases.
Since Week 20, 2024 freight rates and tonnage have continued to move higher
According to WorldACD market data analysis, Asia Pacific origin markets will continue to contribute a significant share of global air cargo growth this year, accounting for more than half (56%) of the +12% year-on-year increase in global cargo volumes in the first 10 months of 2024.
Asia Pacific's strong contribution this year meant its share of global outbound freight volume rose two percentage points from 39% last year to 41%, well ahead of Europe's 24%, Central and South America's 14%, the Middle East and South Asia (MESA) 's 9%, and North America's 8% market share. Based on more than 2 million transactions per month covered by the WorldACD database, Africa's share of outbound and inbound air cargo volumes remained steady at 4%.
Fragile/high-tech goods led the specialty goods growth
As of the end of October, Asia Pacific accounted for 56 percent of the year-to-date global growth, with general freight contributing almost two-thirds (64 percent), thanks to the large amount of e-commerce traffic classified as general freight, while special freight contributed 36 percent. The special freight element is dominated by the consumable parts/high-tech products category, which accounts for about 80% of the growth in special freight.
For Hong Kong, all of the growth in October came from specialty cargoes, mainly wearing parts/high-tech cargoes, while general cargoes recorded a slight year-on-year decline in billed weight. Growth in Miami was a balance of general and specialty goods, while growth in Dubai, Shanghai and Tokyo came mainly from general goods.
Dubai topped the top five markets for year-on-year arrivals growth in October with a 19 per cent increase, followed by Frankfurt, New York, Singapore and Miami. Growth in all five cities was driven by general goods, with specialty goods accounting for about one-quarter to one-third of the increase, and with the exception of New York, all cities were led by fragile/high-tech goods, while temperature-controlled goods (mainly pharmaceuticals) were the largest category of specialty goods import growth.
At the same time, the top five cities with year-on-year declines in inbound passenger throughput were Tehran, Beirut, Beijing, Dhaka and Zaragoza, with Tehran and Beirut experiencing almost zero inbound passenger throughput: Inbound passenger throughput at both airports in October was down -96 percent year-on-year, as most commercial flights to and from Iran and Lebanon were suspended last month.
Dhaka, Beirut and Zaragoza (affected by political unrest, conflict and flooding, respectively) were also among the five markets with the biggest declines in outbound travel in October, followed by Qingdao in China and Guadalajara in Mexico.
Freight, capacity and tonnage all rose in October
According to WorldACD's analysis, global air billable weight increased by 8% month-on-month in October and by 11% compared to October last year. In October, all six of the world's major originating regions recorded month-on-month and year-over-year growth, with Europe (+12%), Central and South America (CSA, +11%), North America (+10%) and Africa (+10%) all Posting double-digit month-on-month tonnage percentage increases. All six regions contributed to year-over-year growth in the 10 months to the end of October, with total billable weight up 12%, with the Middle East and South Asia (MESA, +18%) and Asia Pacific (+17%) Posting the largest year-to-date increases.
Since Week 20, 2024 freight rates and tonnage have continued to move higher
WorldACD's data shows that global total billable weight has been higher than last year's level for most of 2024 and has continued to rise every week since week 8. In terms of pricing, it may take longer for global average full-market rates to surpass last year's levels, but since Week 20, they have been higher than the same period last year. Taking an average for the first 10 months of 2024, the global average full-market rate for the year to date is roughly the same as the same period last year.